
Simple Dev Metrics
| culture | code | craftsmanship | fundamental |
A few years ago as a quick, simple metric, I threw up the tests, coverage and WIP on the wall. Little did I know at the time that some of the leaders paid a lot of attention to them and that I'd be suggesting and using them again. When I first did this, I put it up as high as I could in the corner for all to see. Since this was on a glass wall, it was visible from across the entire company (everyone was on one big floor). This is something any team should be able to do, right now. Especially if they're being pushed for metrics.
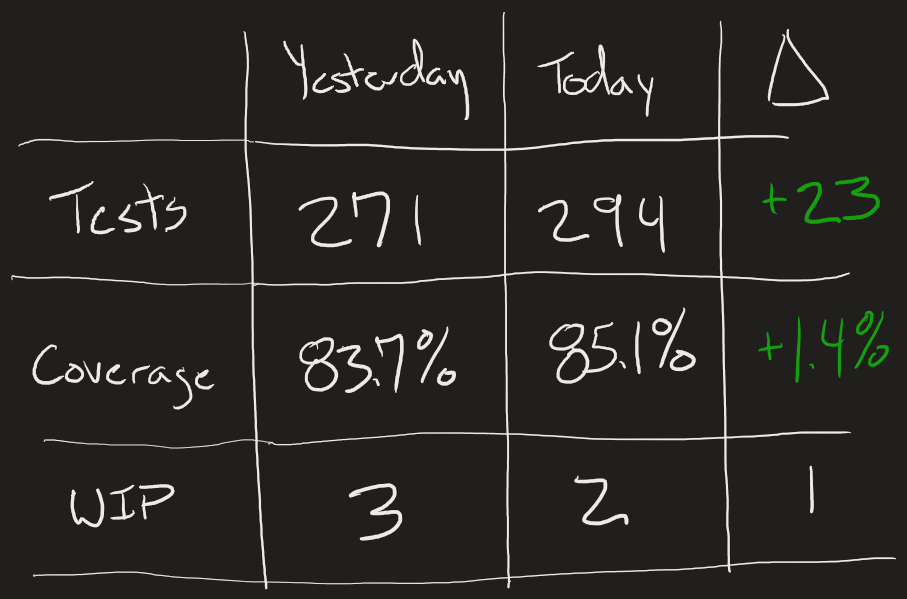
First, why these metrics? What thing am I trying to observe or behavior am I trying to drive? Two parts - 1, a good coding practice (tests, and I didn't care how or with what) and 2,visibility of work being done. So why? What did I expect these to tell me? It was time to ask questions when :
- If tests didn't change, and WIP went down (something wasn't tested, or removed from the work)
- If tests went up and WIP didn't change (something was worked on and still in progress)
- If WIP went down, and tests went up (something was completed)
Business as usual should be tests go up (or down if you remove stuff) and coverage should stay around the same or slightly go up depending on a million factors.